
As a Planning & Zoning Administrator, do you ever feel overwhelmed by all the things you have to get done in a day? gWorks currently works with more than 35 Planning & Zoning Administrators. We understand that there is a lot involved when it comes to Planning & Zoning for a county. You have to coordinate zoning and subdivision cases, issue and manage permits and conditional uses, maintain the zoning districts, handle requests for re-zoning, and administer floodplains. Having easy access to spatial zoning data at your fingertips can help give you the peace of mind and confidence to perform your job effectively.
We designed a Departmental Tab on our WebGIS that is specific to Planning & Zoning Departments to help you complete your day-to-day job functions more efficiently. One of the biggest issues Planning & Zoning Administrators is lack of access to data. Our WebGIS Tab gives you access to a variety of data layers that you can view in a spatial context. The Planning & Zoning Tab gives you what paper maps have previously given you but in an accessible electronic format with the added power of data behind it. And because everything is electronic, it’s easy to keep the layers up to date.
Below are some valuable layers we have created for Planning & Zoning Administrators and how they can help you and your county. These layers can lead to better transparency of data, improved and more responsive decision making, and are easy to use! We also see that counties that make these layers available garner a very positive perception from the public, other county departments, and the Board who all have easy access to this data.
Potential Planning & Zoning Layers and Their Capabilities
- City & County Zoning. You have to interpret your county’s codes and bylaws and promote zoning information. Having access to an interactive map of your Zoning Districts will benefit you while also providing transparency to the public. Each district has regulations on uses that are permitted and influence what can and can’t be done. Be able to clarify where each district starts and ends will lead to better make decisions about land use and development.
- City Limits. Rules and regulations vary based on whether something is located within or outside of city limits. View city limits at a glance and layer them on top of parcels, zoning, or other useful layers.
- Subdivisions & Parcels. Not only can you view subdivision and parcel names and boundaries, but we can include all the parcel information from your Assessor’s Tab, which means you have access to ownership information, property details, valuation, sales history, and more.
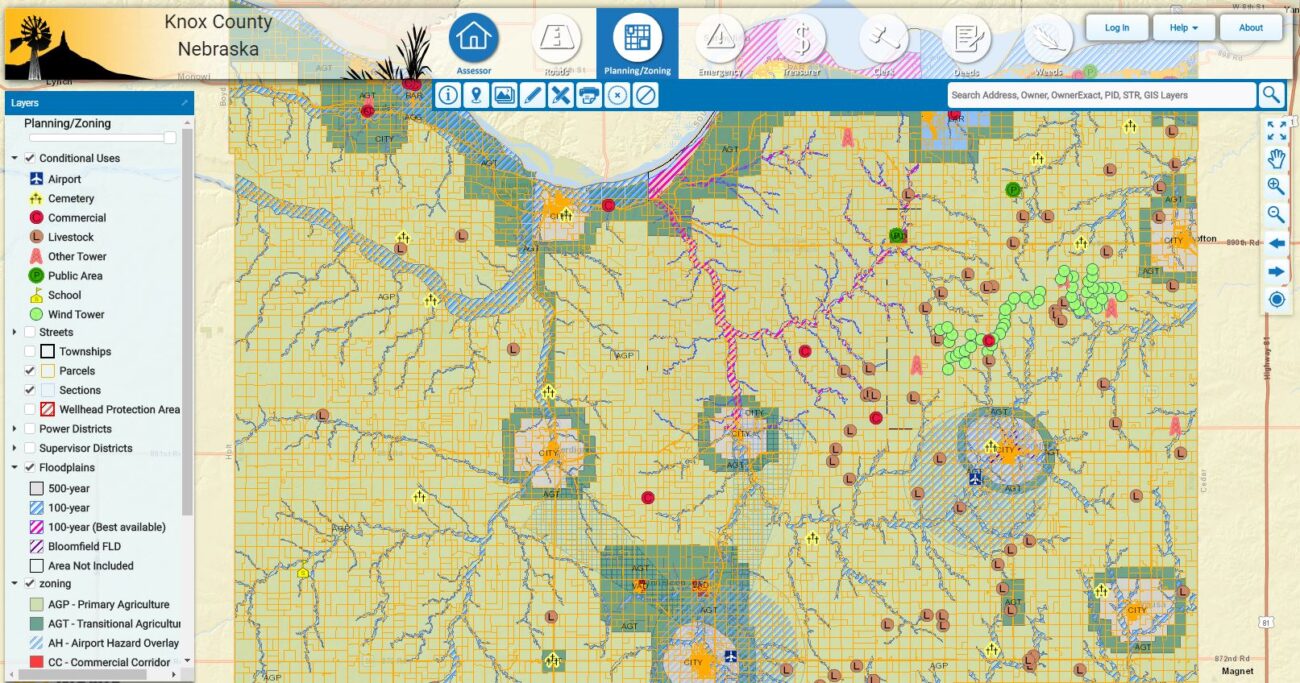
- Conditional Use & Special Use. Planning & Zoning Administrators are responsible for managing conditional use and special use permits throughout the county. From Commercial and Livestock to Cemeteries and Wind Towers, see at a glance where all these are located on a map for more informed decision making.
- Floodplains. Planning & Zoning Administrators often work as Floodplain Administrators. With the floodplain layer, you can see precise property locations within the floodplains. If available, we can also display where the 100-year or 500-year floodplain locations.
- Supervisor Districts. Quickly identify which supervisors are responsible for which areas of your county. With a supervisor district layer, it’s easy to see where one district ends and another begins. This also makes it easy for the general public to see who the supervisor is for their district.
- Airport Zoning. Airports present a variety of unique considerations to anyone involved in community planning, such as height restrictions, land use compatibility, and proximity to landfills or wetlands. If there is an airport in your county, it’s critical to see its location and view its operational zone for optimal community planning.
- Odor Footprints. With the growing diversity of land uses in rural areas, it’s important to provide objective information about air quality issues associated with livestock. An odor footprint layer can help you visualize where such air quality issues may occur and estimated setback distances and assist in siting decisions.
- Swine Confinement. Being able to see the locations of swine confinement facilities aid in improved decision making for Planning & Zoning Administrators and the public who live and work in the county.
- Feedlot Locations. Likewise, tracking feedlot locations can be very beneficial. The regulations around livestock producers can be complex. Knowing feedlot locations will help farmers, producers, and Zoning Administrators correctly follow these regulations and help ensure the correct permits are utilized.
- Wellhead Protection. Knowing exactly the precise locations of your wellhead protection areas is vital to maintaining clean drinking water or controlling potential contaminants.
- ETA/ETJ. City jurisdictions often extend beyond the city limits. Seeing these extraterritorial zoning jurisdictions can help identify correct regulations for anything near city limits.
- Future Land Use. Future land use designations establish general ranges of uses that are permitted in each district along with establishing a range of densities (amount of residential development per acre) and intensities (amount of non-residential development per acre) for each land use category. Future land use maps bring together most elements of a comprehensive plan, including natural resources, economic development, housing, and transportation. This layer is critical to the Comprehensive Plan because it outlines the citizen’s vision for the future. This layer can help define areas within the county that are suitable for various land use activities.
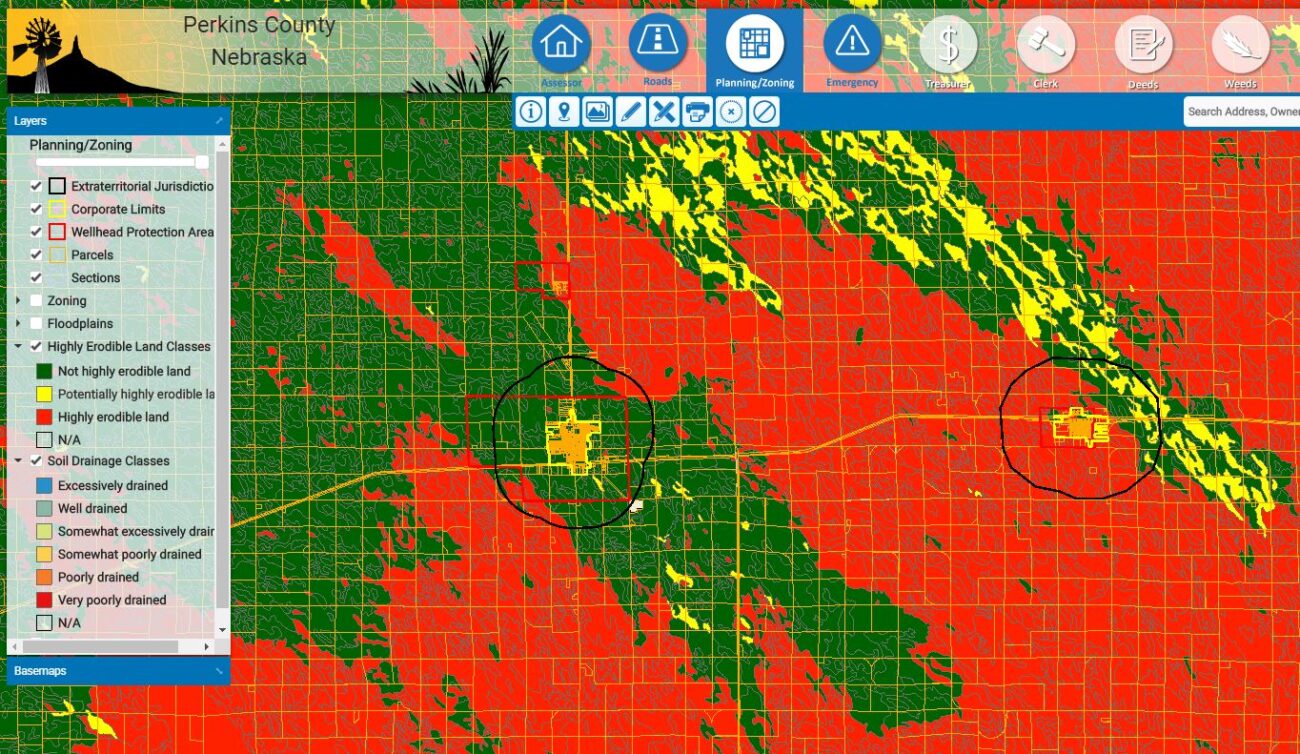
- Soil Drainage Classes. Soil drainage can show which areas are well-drained or not to help planners make better decisions.
- Highly Erodible Land Classes. Viewing highly erodible land locations can help you better determine land conservation compliance and provisions. Access to this layer will help you make decisions that reduce soil loss and protect wetlands.
- Wetlands. Seeing wetland area locations helps ensure ethical decision making and protection of any endangered plant or animal species.
The Whole is Greater Than the Sum of its Parts
One of the benefits of GIS is that you can turn each layer on and off individually. That means that these layers don’t exist alone – you can turn on multiple layers to see how they intersect and interact with each other. While each of these layers has its benefits, adding them together and being able to overlay them brings even greater benefits. For example, seeing feedlot locations on top of zoning, floodplains, and wellhead protection areas paints a much clearer picture of what permits may be needed and what steps must be taken to ensure safety. Seeing erodible land classes or soil drainage classes on top of zoning can help Zoning Administrators and planners make educated decisions about new developments or where new feedlots shouldn’t and shouldn’t be located.
Know you are making informed decisions regarding permits, conditional uses, and zoning changes with easy access to a wide variety of layers. Have data to back up your decisions and protect yourself from potential disputes or issues.
Not only will having this data easily accessible in one place give you confidence and peace of mind, but it will also be a huge benefit to your residents. Most counties with a Planning & Zoning Tab experience a positive public perception because data is easy for anyone to get. This can save you time and stress from answering phone calls and handling requests or drop-ins to the office. And by enhancing the transparency of data, the public will know they can count on your county.
Our Planning & Zoning Tabs average 12 different data layers that will help you improve decision making and provide the public access to information they need when they need it. There is no limit to the number of PZ related layers we can display, and the more layers you employ, the more beneficial the Tab will be.
If you have any questions about enabling a Planning & Zoning Tab for your County or getting any of these layers added to your Tab, contact info@gworks.com today!